Business Intelligence (BI) for construction reporting and dashboards
Turn project data into clear decisions with one practical service stack. Our Business Intelligence (BI) team helps you automate updates, reduce reporting admin, and give leadership instant visibility. You spend less time chasing spreadsheets and more time managing delivery.
Not sure where to start?
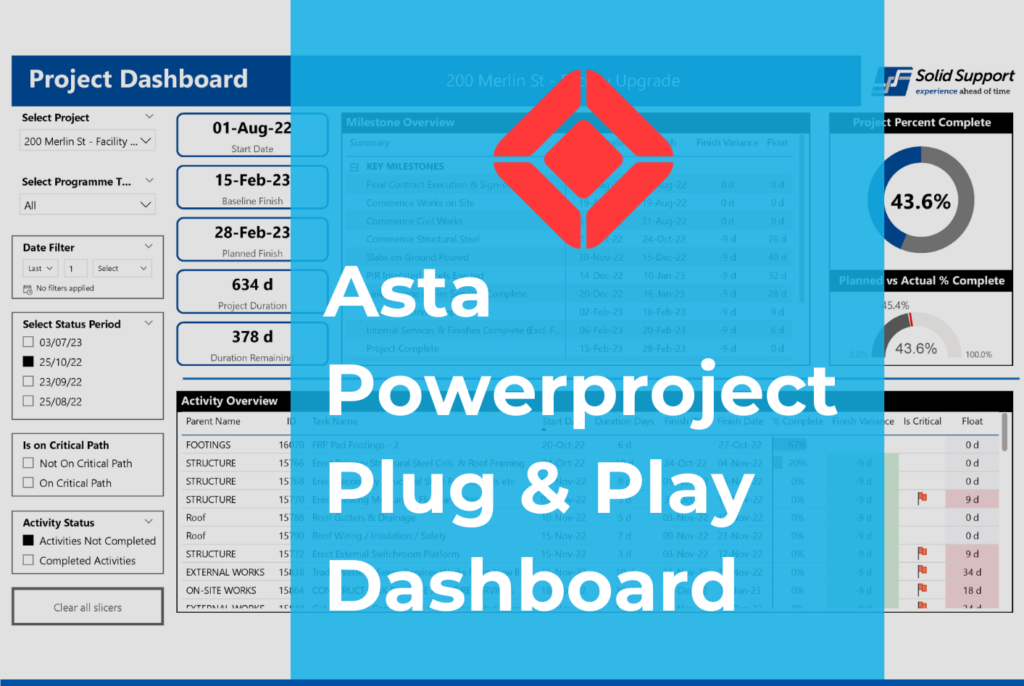
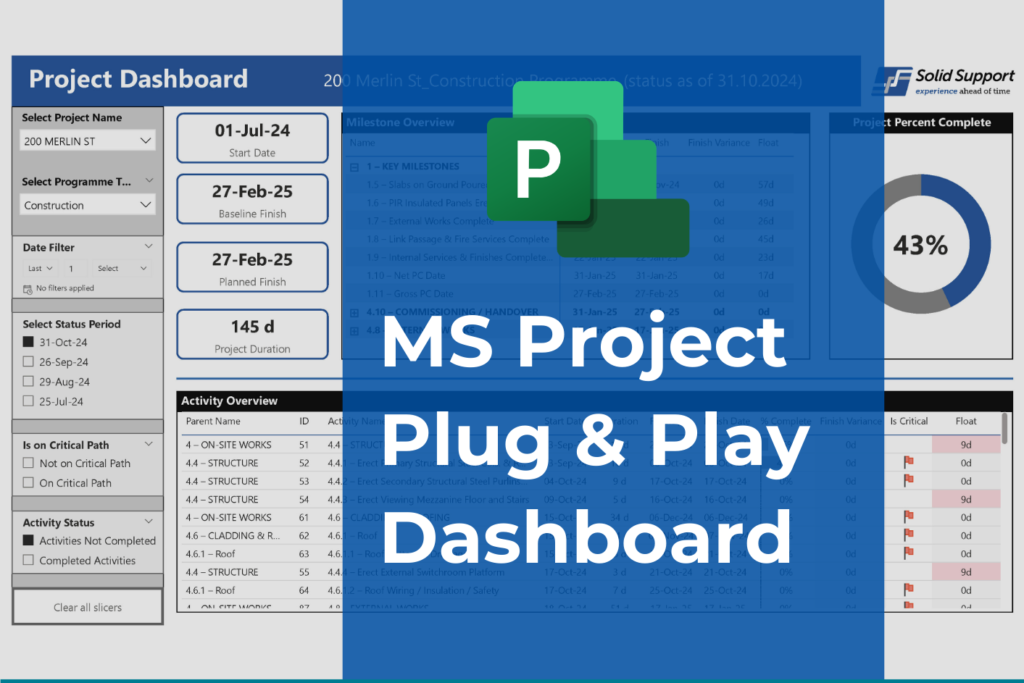
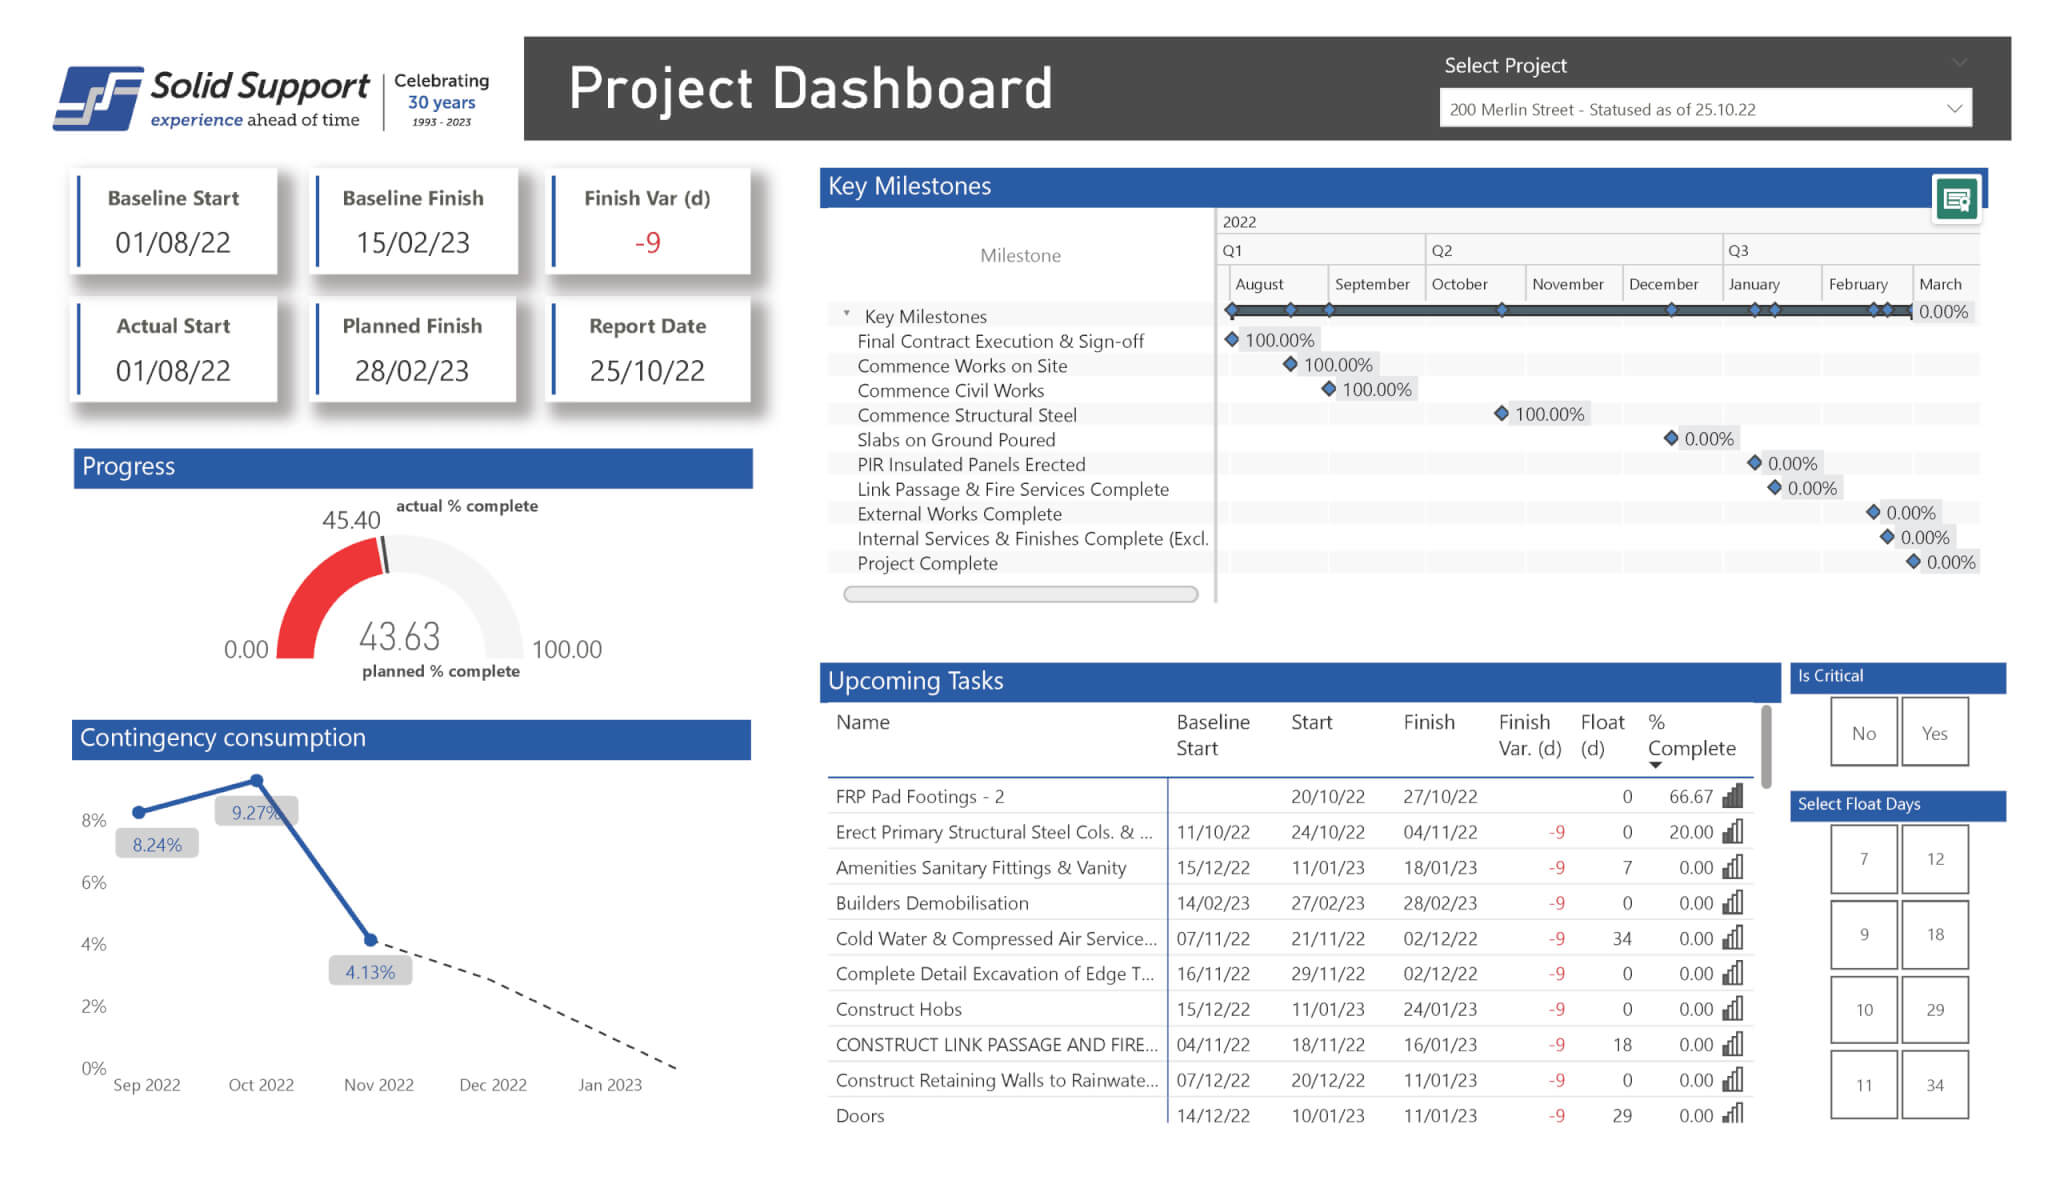
Most clients begin with a Plug & Play dashboard, then extend into custom reporting or training as their needs grow.
Explore a live demo — click, filter, and interact just like the real thing.
Powered by Power BI — interactive filters and visuals are fully functional.
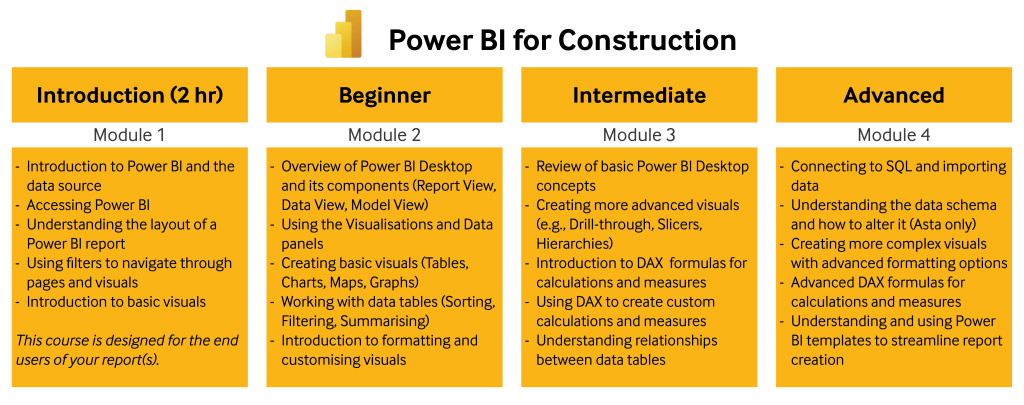
Power BI for Construction training
Give your team the skills to turn construction data into clear, trusted insight. Our Power BI training is designed specifically for construction professionals — not data analysts. We focus on real project data, practical reporting scenarios, and the metrics that matter on site, in the project office, and at management level.
From understanding existing dashboards to building and extending reports, our training helps teams:
Reduce reliance on manual Excel reporting
Trust the numbers coming from programmes and cost data
Confidently analyse progress, performance and risk
When standard reporting isn’t enough, we design custom Power BI dashboards built around how your projects and business actually operate. Starting from your programme, cost and project data, we extend beyond Plug & Play to deliver deeper insight, automation and integration — without compromising data integrity.
Our custom dashboards support:
Earned value analysis (SPI, CPI, forecasts)
Labour and productivity trends
Cost tracking and forecast-to-complete
Programme risk and delay indicators
Multi-project and portfolio-level reporting
Integration with planning, cost, finance and other project systems
The result is a single, trusted view of project performance — replacing complex spreadsheets with clear, interactive reporting that supports confident decision-making at every level.
Performance & Benchmarking
Beyond dashboards, we help construction businesses understand performance trends across projects, teams and time.
Using consistent data structures, we enable:
Cross-project benchmarking
Historical performance analysis
Early identification of delivery risk
Evidence-based planning improvements
This is where reporting becomes competitive advantage — not just compliance.
Why teams choose Solid Support
Construction-specific BI — not generic consulting.
Dashboards live in days, not months.
Your team owns it — we train and hand over.
Trusted by tier-1 and tier-2 contractors across Australia.