Getting Started with Asta Powerproject data into Power BI
If you’re anything like me, you know that managing project data effectively is as crucial as laying a strong foundation for a building. You’re already on the right track with Asta Powerproject, but what if I told you there’s a straightforward way to elevate your data game? Let’s walk through how you can effortlessly export your project data from Asta and create a sleek, informative dashboard in Power BI.
Asta Powerproject is renowned for its comprehensive scheduling capabilities, serving as the backbone of construction project planning. When this is seamlessly integrated with Power BI’s exceptional data visualisation tools, it results in a powerful combination that affords a detailed, real-time overview of project status. This synergy facilitates a level of insight that enables project managers to make well-informed, timely decisions, ensuring project objectives are met with efficiency.
This article was written for planners and project managers for example that want to get started with Power BI using construction planning data from 1 project. If you are after a project portfolio dashboard solution for multiple projects across a state or multiple states, contact or BI consultants at experience@solidsupport.com.au or connect with Sanne on LinkedIn here.
The Export to BI functionality is a standard feature in Asta. If you don’t see this option in your Ribbon, you simply need to activate it.
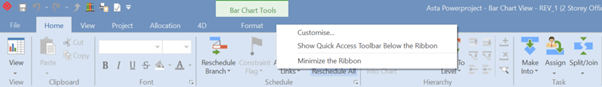
Right click somewhere on your Ribbon > Select Customise…
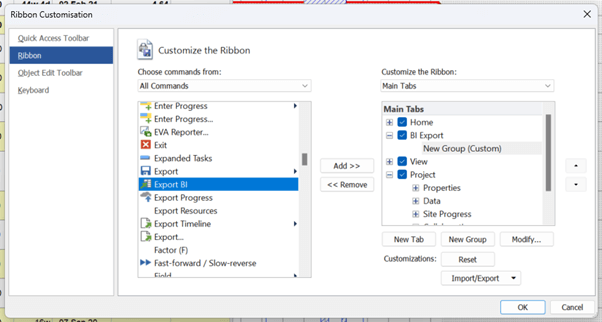
From the commands list, scroll down until you see “Export BI”. Now on the right-hand side navigate to one of the Tabs (expand and click on a sub Tab), or create a New Tab.
Make sure you select Export BI on the left, and your Tab on the right. The “Add >>” button will now appear in the middle. Click on it.
You have now successfully added the Export BI functionality to Asta.
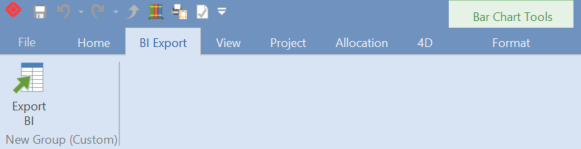
You should now be able to see it appear in the Ribbon
2. Click on the ‘BI Export’ button, which initiates the process of collating the project data into a BI-friendly format.
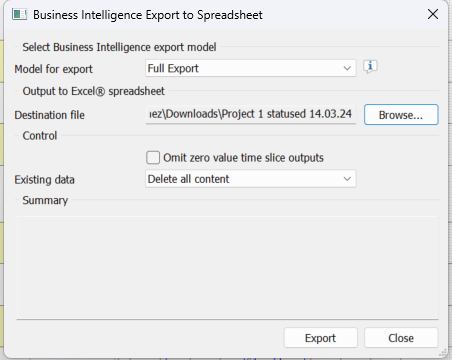
3. Select your preferred Model for export. I would recommend the Full Export in most cases since it’s the most comprehensive export and therefore a great starting point.
Although the name suggests it, this is not a Full Export of all of your data stored in Asta Powerproject. If you are missing any data in the export, please reach out to our consultants so they can help you expand the export.
Note that any information based on a formula’s in Asta can be included in the export. Even custom created columns. This is a great advantage of Asta over other scheduling software to Power BI exports, such as P6.
Select where you want to save the export under “Browse…” and write down a File name. My suggestion would be to add your Project name and Status Date.
Leave the “Existing data” option to “Delete all content”. If you choose another option, you risk ending up with too much data in your exports. The delete all content deletes all “old” information and overwrites it with actual programme data.
Click on Export. It might take a few seconds for the export to complete.
Step 2 | Import Data into Power BI:
Once you have your data ready, the next step is to bring it into the Power BI environment:
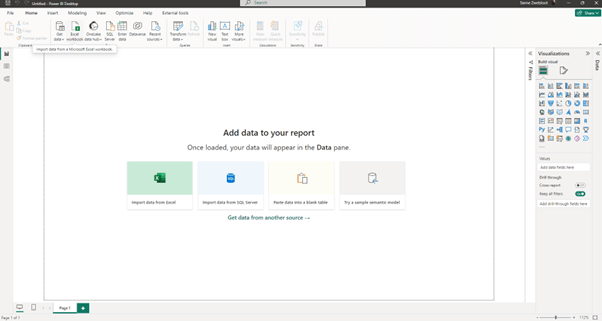
Launch Power BI and select ‘Get Data’ from the Home ribbon.
Choose ‘Excel’ as the source file type
Navigate to the saved file and import it. In the Navigator you can select the tables you want to import. You typically don’t need all the tables. For beginners I would recommend selecting the Milestone, ProgressPeriod, Project and Task tables.
Select Load.
Power BI will read the data structure and load it into its environment.
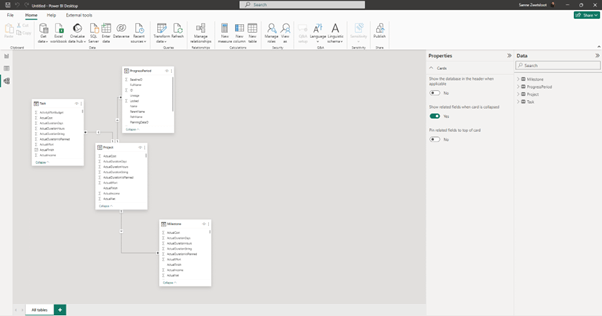
6. Go to the Model view. This can be found selecting the 3rd icon on your left-hand side.
7. In this overview you see the relationships created between the tables. Table relationships are very important and it is crucial to get this step right. If the table relationships are incorrect you risk ending up with the wrong data in your dashboard.
8. Power BI is typically very good in setting this up and does a great job with these 4 tables. If you have imported more tables, you would need to run a check on the relationships and improve where needed.
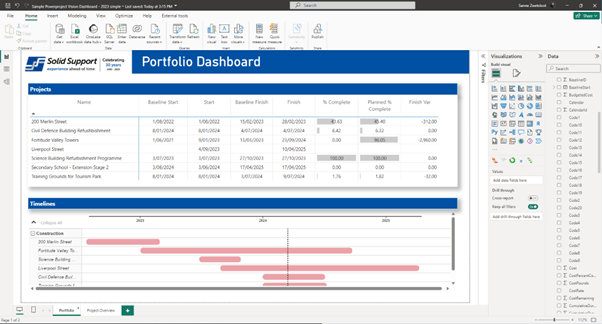
Step 3 | Create a Dashboard in Power BI
With your Asta Powerproject data imported into Power BI, it’s time to bring this data to life through interactive dashboards:
Use the ‘Reports’ canvas to drag and drop visualisations, such as Gantt charts, pie charts, or bar graphs, representing different data points.
Link data fields to these visualisations. For example, link your task data to a Gantt chart to create a visual project timeline.
Customise the appearance of your dashboards by choosing colours, setting up filters, and adding slicers for interactive data exploration.
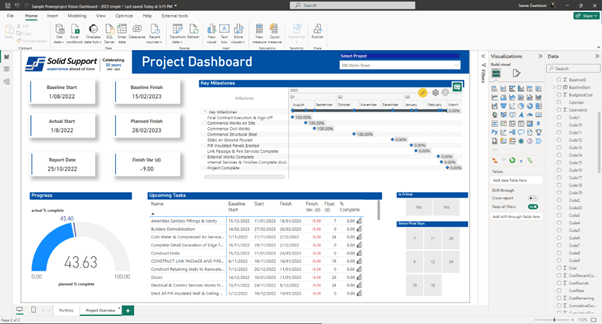
Create multiple pages within your report to focus on different aspects like project overview, detailed scheduling, resource allocation, and risk management.
The combination of Asta Powerproject and Power BI is transforming the construction industry by providing an integrated solution for project management. By bridging the gap between project planning and data analysis, managers are equipped with a powerful toolkit to ensure that their projects are completed on time, within budget, and to the highest quality standards.
If you need further assistance with the integration of Asta Powerproject and Power BI, Contact us at Solid Support for expert guidance, training, and support. We have worked with tier 1, 2 and 3 construction companies as well as various consultancy firms to create project programme dashboards, costing dashboards, safety dashboards, and more.