
Multiple ways to communicate delays visually.
With the Covid-19 pandemic still affecting Australia across various economic sectors, construction is no stranger to the delays caused by the pandemic. This pandemic has caused delays to the supply chain and has affected the availability of workers across construction sites. Governments in the various states and territories have implemented restrictions on construction activities in some ways. As result, we have to communicate how these restrictions affect the construction programme.
There are different methods of showing these restrictions visually. Each method varies in applicability, complexity, and usefulness. You must use these methods in addition to other delay analysis methods to represent the claim. This article is limited to showing how different features of the software can be harnessed in a project status update and a delay claim submission. You should contact one of our consultants to advise based on your particular situation.
Method 1: Calendars
The State/Territory government has issued a general work stoppage order that shutdowns construction work on a site in specific geographical areas. You can show this delay using the calendars.
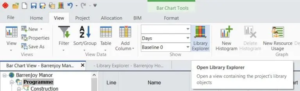
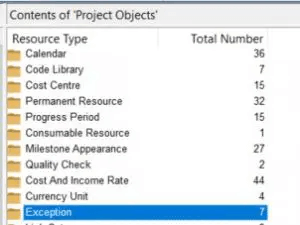
Go to the View tab > Select the Library Explorer command icon > Open the Exception folder.
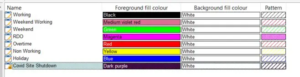
Click in the new row and create an exception labelled ‘Covid Site Shutdown’. Choose a colour and pattern.
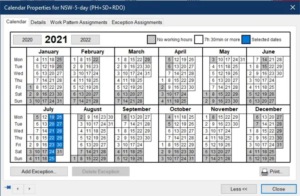
In the Library explorer, go the Calendar folder. Select the affected on-site calendar.
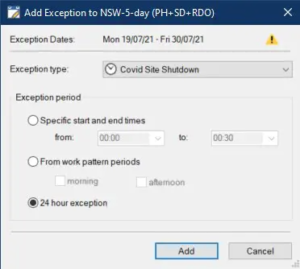
Select the days where the site was shut down because of the Covid restrictions. Select Add Exception.
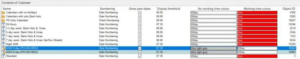
Select the Exception type as Covid Site Shutdown and Exception period as 24 hour exception.
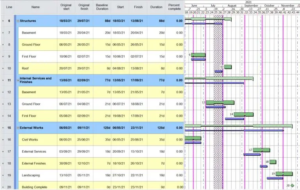
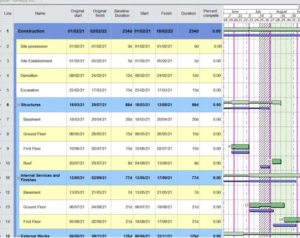
Go to the Bar Chart view, you will see the Covid Site Shutdown days in the colour/pattern selected for this non-working day exception. This is shown on tasks that were assigned to the affected on-site calendar.
Method 2: Shading in the Gantt Chart
Some states have restricted the availability of labour resources from certain local government areas (LGAs). While the work can continue – the number of resources available may be less for some tasks. You can indicate this period of restricted resourcing using the Shading in Gantt Chart approach.
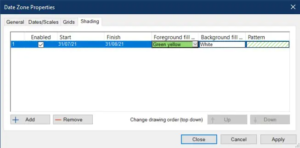
Go to the Bar Chart Tools (Format) tab > Select the Shading command icon.
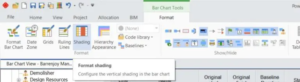
Add the start and finish dates of the period of restricted resourcing. Select the colour and pattern as well.
Method 3: Code Library
You can also use the Code Library to label your delayed tasks, NOD and EOT claims.
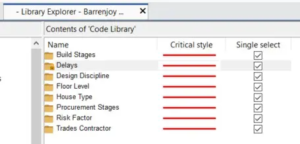
Go to the View tab > Select the Library Explorer > Click on the Code Library folder.
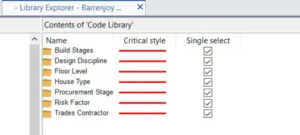
Right click in a blank spot and select New Code Library.
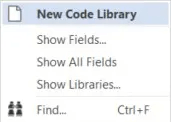
Name the library as ‘Delays’ > Click open the folder.
Right click in the blank space > Select New Code Library Entry.
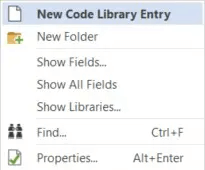
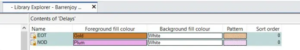
Create delay codes e.g., EOT, NOD.
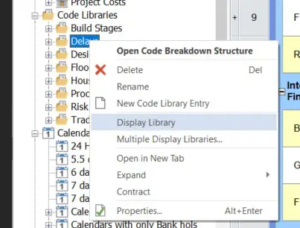
Go to the Project View > Select the Code Libraries > Select Delays > Right click > Select Display Library.
Drag the desired code library entry to the bar on the Gantt Chart.
The post Quick Tips & Tricks – Showing Delays appeared first on Solid Support.